How to Easily Start Arguing Using Data

I came across using data as a tool about six years into my career. Well, I knew the basic concepts and usage, but it wasn’t really a tool I used. I wasn’t comfortable enough with it to use it seamlessly, and I always found a way around it. But I shouldn’t have.
In this post, I’ll explain how you can get so comfortable that you will use it all the time, not only when you are asked to. So if you want to have less friction when data is involved (or should be involved), this post is for you!
Data-Driven Decision-Making - Overview
Data-Driven Decision Making (DDDM) transitioned from a trend to a “must-have” for every organization long ago. It’s an essential skill for teams to prioritize tasks, locate pain points, or optimize processes. This is important not only for decision-makers, but also for team members trying to drive decisions and gain influence.
Looking into the formality of DDDM, I’ve found many different definitions, all amounting to pretty much the same. One example is this definition from Tableau:
“[The act of ] using facts, metrics, and data to guide strategic business decisions that align with your goals, objectives, and initiatives.”
But we’re not here to talk about all the benefits or ways to implement DDDM - we’re here to talk about you, and how you can leverage the fact that this is how decisions are made in your company/team to your advantage.
First, we need to understand the basic structure of a “data project” and get some hands-on experience - and this is exactly what we’re going to do. In the next section, we’ll walk through the steps of a data project with a public database. This should give you the tools to perform “fun side projects” like this or implement the methods using your data and your team’s questions.
Data-Based Argument Cycle - Example
In this simulation, we’re working for a company that’s building a sports streaming product and, as part of the process, has built databases about basketball players and teams. We will go through all the steps of the process, explaining what exactly we’re doing in each step, and emphasizing where the process is probably different from what you might experience in your organization.
Defining the question
To define the question, we first need to define the problem, so let’s imagine a scenario:
You noticed that when ordering the users on their “Minutes Played” field, you get that the player who played the most minutes is Vin Baker, even though you know that’s not the case. You are convinced that something is off, but you want some proof to back this up. If you cannot access the code or if finding the issue in the code is difficult, you can try to back up your “this is a bug” argument with data!
Accessing the data
The first thing you should do is learn where your organization stores its data and how to access it (for example, the data is stored in AWS RDS and is accessible using an SQL interface).
In our example (and because we’re not actually working for a streaming company), we’ll get the data from a public source - https://www.basketball-reference.com. We’ll first run this Python code to get the data:
import pandas as pd

url = 'https://www.basketball-reference.com/leagues/NBA_1995_totals.html'
df = pd.read_html(url)[0]

df.to_csv('all_players_1995.csv')
These lines will create a .csv file containing our database, which in this case will be a data frame (but for now is a table) where each row represents a player with their respective stats.
While understanding all aspects of the data is important, it is usually unnecessary to go into every detail of the first query. Usually, you’d want to get a general grip (badum-tss) and go into details only when a specific question is given. So let’s get to the question.
Querying
In the case of this example, we have a .csv file and not a fully-functioning DB with an SQL interface, so we’ll improvise such an interface. We’ll run the following Python lines creating a global DataFrame (called “df”) that will be accessible with SQL:
from pandasql import sqldf
import pandas as pd

df = pd.read_csv('all_players_1995.csv') # read the CSV
df = df[df['Player'] != 'Player'] # drop unrelated rows (specific for this)
df['MP'] = df['MP'].astype(int) # convert column type (MP=Minutes Played)
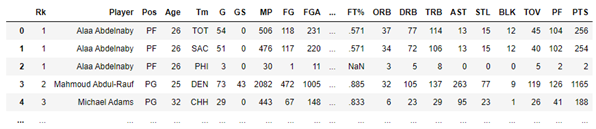
Now that we’re able to run SQL queries, let's first test the initial problem and locate the top five players, which will show the following result:
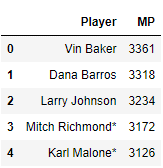
It seems like our suspicions were right. Vin Baker does have the most minutes played! But feeling familiar with the data, we can notice that there is also a column called “Tm," representing the team of the player! This means that a player might have played for more than one team and thus have more than one row.
This is also easy to test using SQL, combining all rows of the same player and summing up their minutes:
q = ''' SELECT Player, SUM(MP)
FROM df
GROUP BY Player
ORDER BY 2 DESC
LIMIT 5'''
sqldf(q, globals())
Which presents the following result:
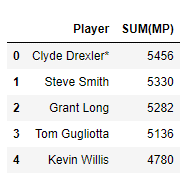
Bingo!
Presenting results
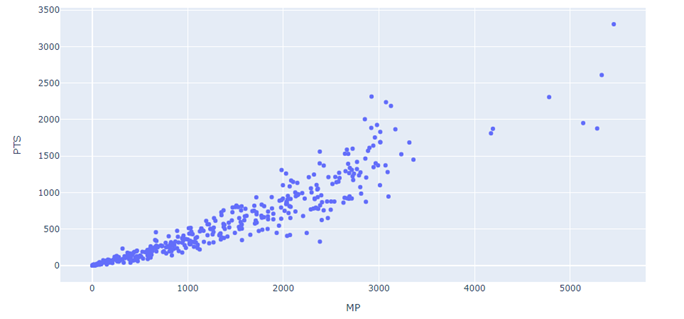
Showing the tables above along with an explanation would have been enough to make your case, but in other cases, we may want to drive the point further with illustrations of the data. This is also relatively easy to do, like in this example showing the correlation between minutes played and points scored (column name is PTS):
import plotly.express as px

q = ''' SELECT Player, SUM(MP) as MP, SUM(PTS) as PTS
FROM df
GROUP BY Player'''

agg_df = sqldf(q, globals())
fig = px.scatter(agg_df, x="MP", y="PTS")
fig.show()
Which will show the following graph:
Just Another Tool
Imagine you’re a developer, and you’ve found a bug in the data presented to a client. Instead of starting a cycle of meetings with your manager, a PM, and an analyst - you can come prepared for the first meeting with answers to many of the questions that they might ask:
How badly is the client affected?
How many other clients were affected?
How will fixing the issue affect the database?
The goal is not to master data but to feel comfortable enough with each part of the process so it feels easy. Even if you have a way around the issue, it will slow you down in the long run - it’s like debugging with “prints” because you don’t feel comfortable with the debugger.
As I said, I adopted data as a tool relatively late, not for lack of knowledge. But intuitively enough, the more I went through the cycle, the easier it became, and the quicker I found myself using it again. I now use the data in my organization as easily as I use Google Search. It’s just another tool.
So the next time you feel like you’d want to check something in your environment, I recommend you go through these steps and answer them on your own. Asking for help is okay (and even recommended), but ensure it’s only help and not outsourcing.
And if you can’t wait until you find the next opportunity in your team (or you’re afraid you’ll embarrass yourself, which you won’t), you can always use the code here and research some basketball. As they say - “practice makes perfect” :)