Enabling Chrome Extension Logging with Datadog: A Journey of Trial and Error
A Deep Dive into Chrome Extensions and Datadog Integration: Challenges and Solutions
Logging is a critical aspect of developing and maintaining software applications, providing valuable insights into their behavior and aiding in troubleshooting. When it comes to Chrome extensions, enabling comprehensive logging from various components, such as content scripts, pop-ups, and background scripts, can present unique challenges. Additionally, streaming these logs to a centralized monitoring platform, like Datadog, adds another layer of complexity. In this blog post, we will delve into the intricacies of logging from different parts of a Chrome extension and explore effective strategies for streaming those logs to Datadog for comprehensive monitoring and analysis.
🕸️ Chrome Extension Logging: Architecture
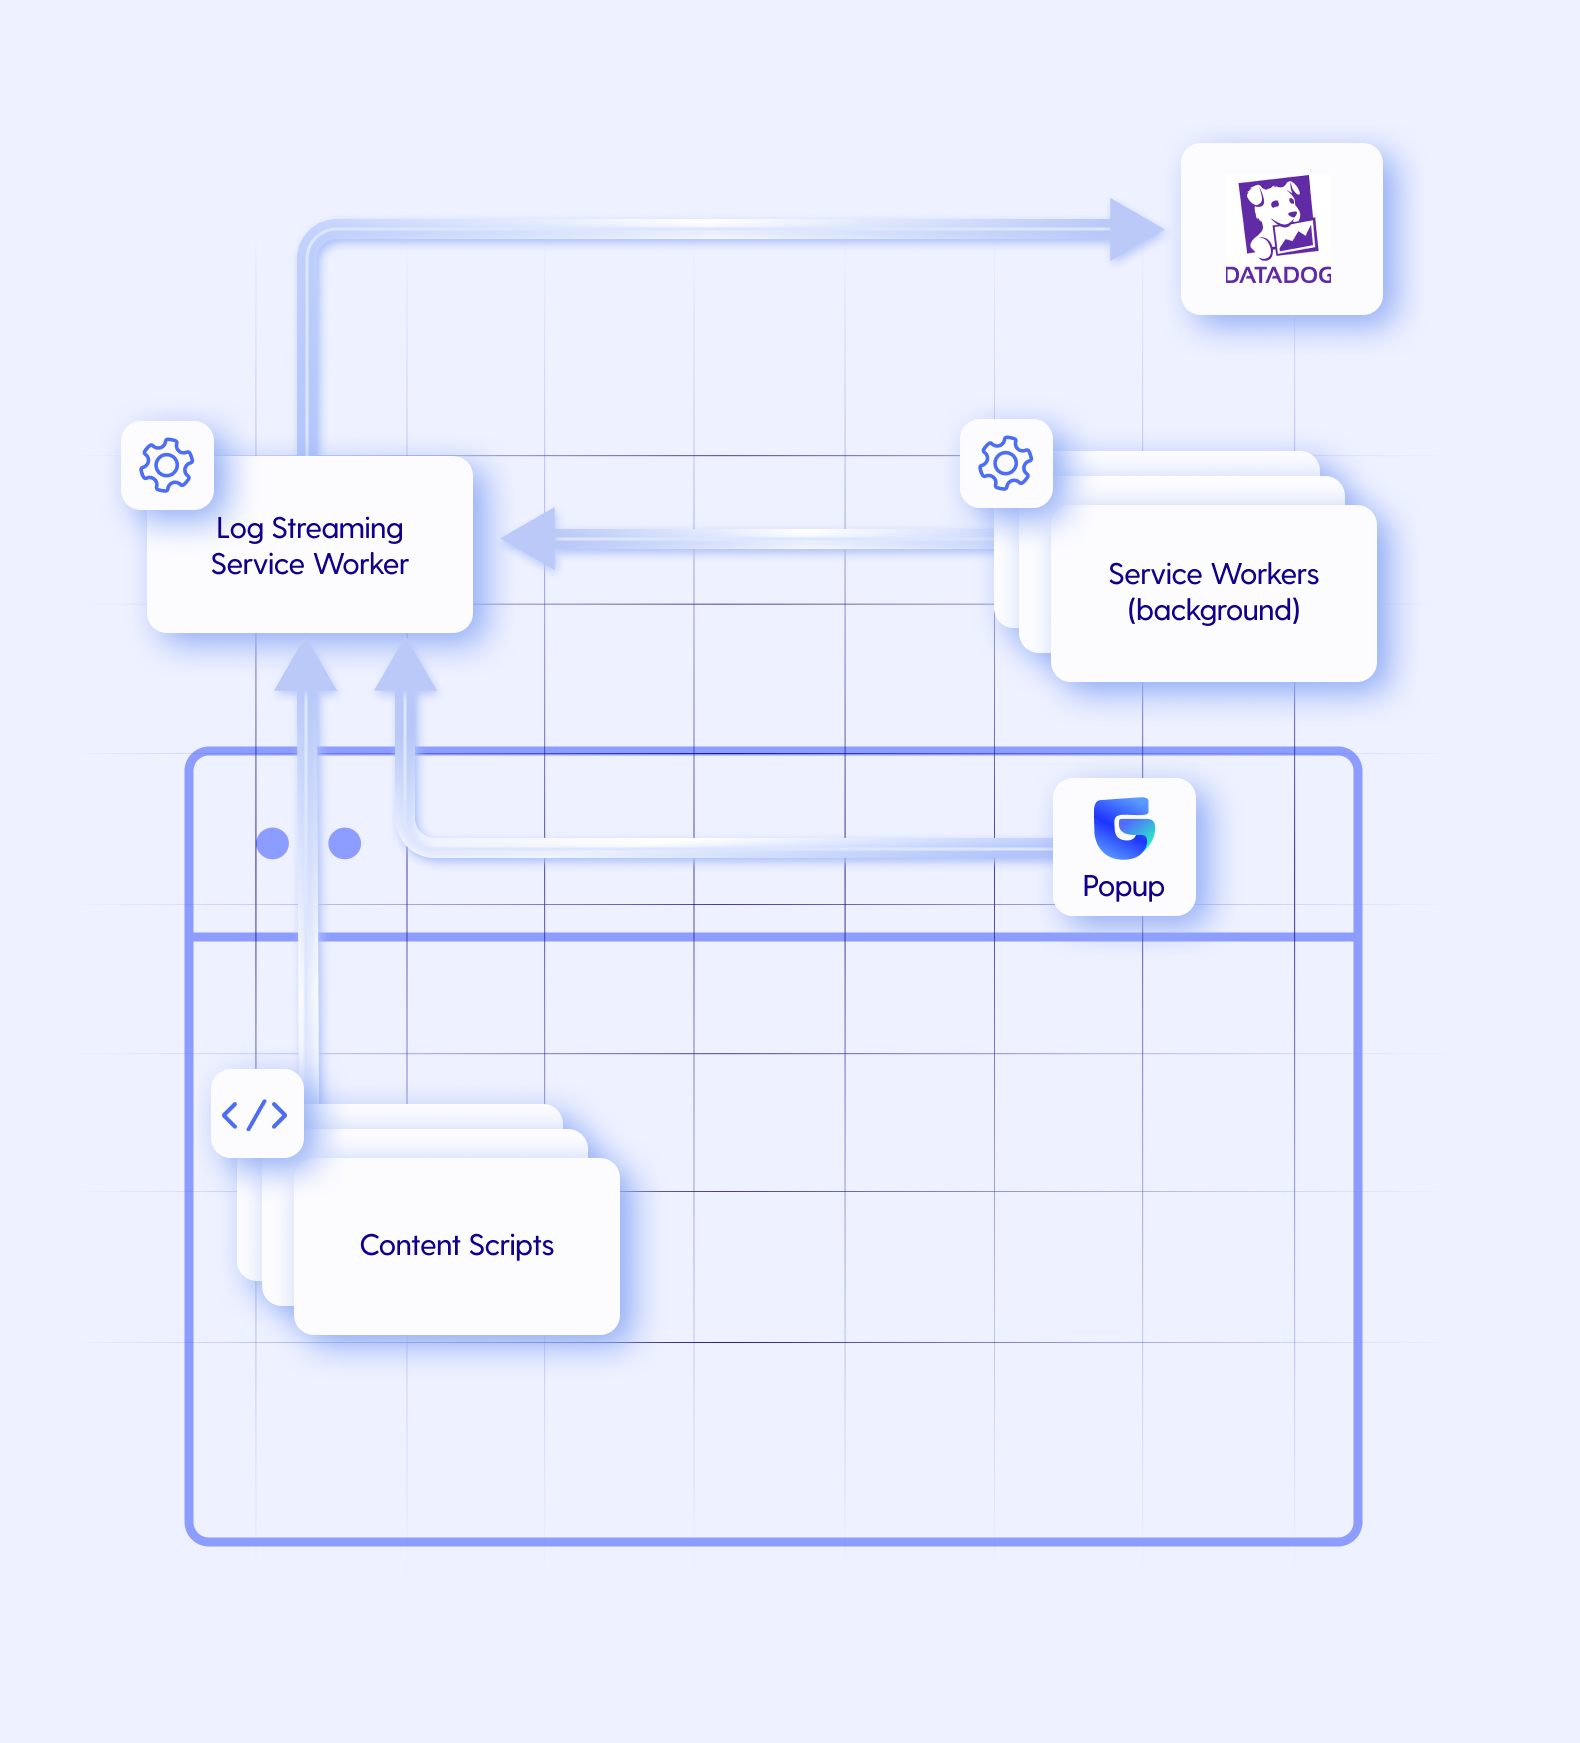
Our journey began with the challenge of understanding how to enable logging across all parts of a Chrome extension effectively. Since our goal is to stream all of the logs to a centralized location, we've started exploring different techniques to capture and consolidate logs from content scripts, pop-ups, and background scripts. By understanding the logging capabilities and limitations of each component, our goal was to create a unified and comprehensive logging solution.
One challenge we encountered during our journey was that content scripts in Chrome extensions may face restrictions imposed by Content Security Policies (CSPs), which can block HTTP requests required for logging purposes. To overcome this limitation, we found it necessary to centralize the logging mechanism within the service worker. By leveraging the capabilities of the service worker, we were able to capture and consolidate the logs from content scripts and other components, ensuring uninterrupted logging even in the presence of CSP restrictions.
🎥 Streaming Extension Logs to Datadog
Now that we've got all of the logs in one centralized location (our service worker), we want to start streaming them to Datadog. We assumed that it would be very simple and straightforward to use the Datadog Browser Log Collection. This assumption was a major mistake.
🫥 The Challenge - Missing document and window
We've finished implementing the entire architecture as described. There was only one thing left and it was using @datadog/browser-logs to stream the logs to Datadog.
We've implemented the basic functionality and were disappointed to discover the following error:
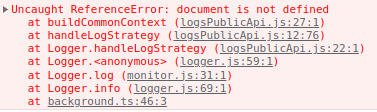
It seems like the Datadog logging library for the web requires document and window configured in the global context. Since we are running inside a service worker, both of these variables don't exist in our context.
A short Google search raised the following open Github issues in the Datadog logging library
Despite this setback, we saw the issue as surmountable. We began implementing minor polyfills for document and window to get the library working. Although the library stopped raising exceptions after implementing the necessary polyfills, it didn't send the logs to Datadog.
At this point, we've come to the understanding that we need to rethink our process and find new ways to achieve the same goal.
After some brainstorming, we've come up with the following options:
❌ Stream the logs from one of the content scripts instead of the service worker
CSP constraints on content scripts are very limiting
Many content scripts can be loaded at the same time to multiple tabs - which requires a complex architecture
❌ Find another logging library and platform that supports Chrome extensions
- There's absolutely no logging library for Chrome extensions - All existing logging libraries are either for regular websites or for Node.JS
❓ Upload the logs to our backend which in turn will stream the logs to Datadog
- This will dramatically increase the load on our servers
❓ Implement the same API requests as Datadog's logging SDK performs
- This is an "undocumented"
browser-intakeAPI. It may break or change at any moment without us knowing.
- This is an "undocumented"
❓ Check out if there's an official Datadog API we can call directly instead of using a logging library using
@datadog/datadog-api-clientThere is an official API for logging - Datadog Logs API reference
According to the documentation, the API requires an API key and not a client token.
Datadog API keys are private, we can't use them in our extension since they will be accessible to everyone
For security reasons, API keys cannot be used to send data from a browser, as they would be exposed client-side in the JavaScript code. Instead, web browsers and other clients use client tokens to send data to Datadog.
✅ The Solution - Using Datadog API
During the research process, we discovered an interesting insight. Datadog client tokens and API keys are very similar to each other.
| API key | 264f471f058cda49a768715edadca33a |
| Client token | pubcea7edf6c6492736768cbaddb7354ee |
We can see that the client token structure is identical to the API key (32-byte hex encoded string). The only difference is that the client token starts with pub which probably stands for "public".
Based on these findings, we decided to try using the official Datadog logging API with the client token instead of the API key.
import { client, v2 } from "@datadog/datadog-api-client";
const configuration = client.createConfiguration({
authMethods: {
apiKeyAuth: "pub**********", // Our client token
},
});
const apiInstance = new v2.LogsApi(configuration);
const params: v2.LogsApiSubmitLogRequest = {
body: [
{
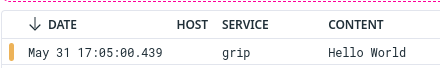
ddsource: "grip",
ddtags: "env:staging,version:1.33.7",
message: "Hello World",
service: "guyg",
},
],
};
await apiInstance.submitLog(params);
Snippet Notes
Content-Encoding. The Content-Encoding in Datadog's example causes the datadog/datadog-api-client library bufferFrom which is implemented for Node.JS and not for the web. After reading some of the library source code, we've identified that we can remove the default Content-Encoding from the example, and by that the entire flow works for the web.And it worked! 🎉
🔄 Future Considerations
Given our success with this approach, we'll likely keep using it in the future. However, it's important to remember that our workaround relies on a certain similarity between client tokens and API keys. If Datadog changes how client tokens or API keys are structured, our approach may need to be revised.
Moreover, since our workaround employs an 'undocumented' method - using the client token in place of the API key - there could be hidden limitations or restrictions we haven't yet encountered. As a result, we must continuously monitor our logging system and remain prepared for potential troubleshooting and adjustments.
🧩 Final Thoughts
Logging in Chrome extensions and integrating with Datadog presented unique challenges because of specific architecture and platform issues. But, with some creative thinking and technical know-how, we managed to build a solution that works for us.
Our experience shows that problem-solving, understanding your tools, and determination can help overcome tough challenges. Our unique solution for Chrome extension logging is proof that it's possible to find new ways to tackle problems when we're willing to think differently.
We hope our story can help others facing similar challenges in their work. With the right mindset and a willingness to try new approaches, you can solve any problem that comes your way!